//Balloompics
Conceptual design practice of social body data utility
Balloompics
Project description
- Balloompics: Conceptual design practice of social body data utility
- Project type: Coursework
- Course: Design Practice
- Date: Oct 2013 – Nov 2013
- Credits: Andria Procopiou, Hana Kim, Hou ZonYo, James Laurie, Zhihao Lu
Requirements
- Design an object, interface, system, or service to help share self-awareness, understanding or appreciation for BodyData in the form of a concept or working prototype
- Adopt a broad social and cultural focus
- New solution for new groups of people addressing new issues
Design solution
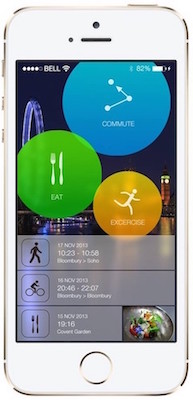
The initial body data is collected by the millions of personal devices throughouttheworld, including mobile phone apps and wearable body-data devices. User’s records related to exercise, diet and travel method can be shared to the public through our design. The application automatically evaluates the data input as a function of positive social action. If judged to benefit society or be eco-friendly, the data will contribute towards the user’s personal ‘bubble’. Further exercise and a continuous low carbon lifestyle will enlarge the bubble.
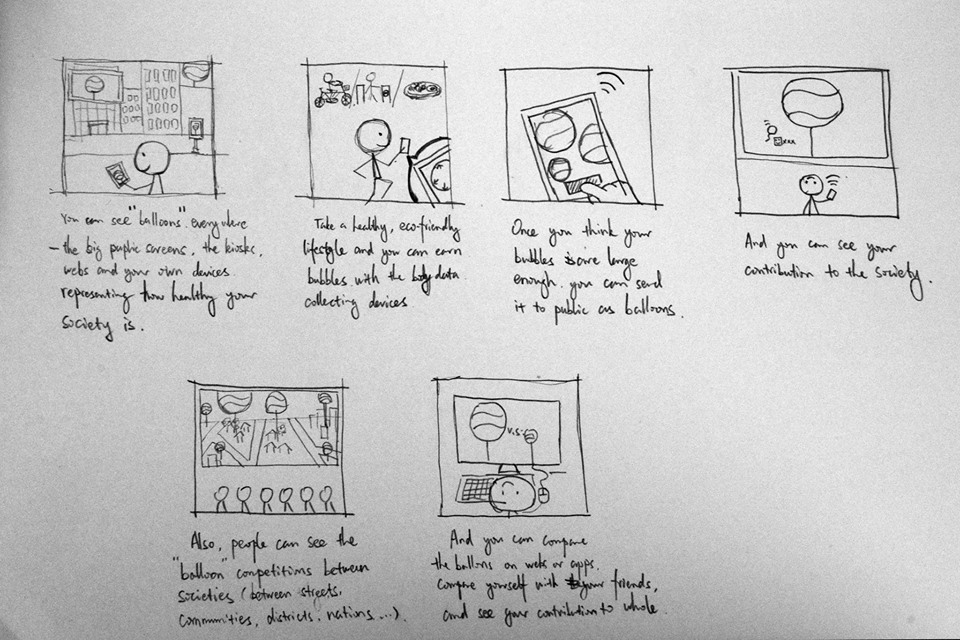
Storyboard
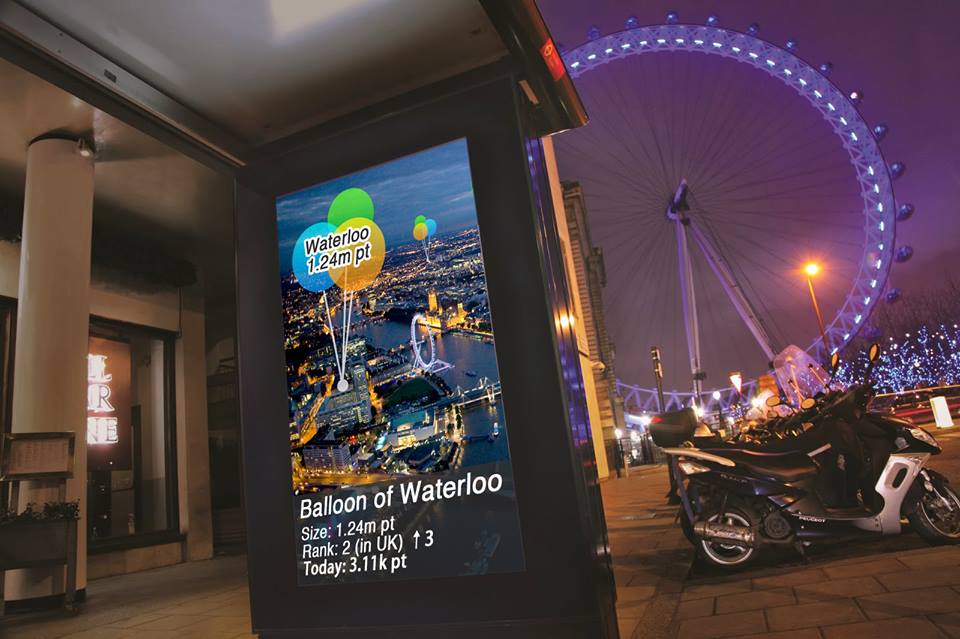
Interact with public screens
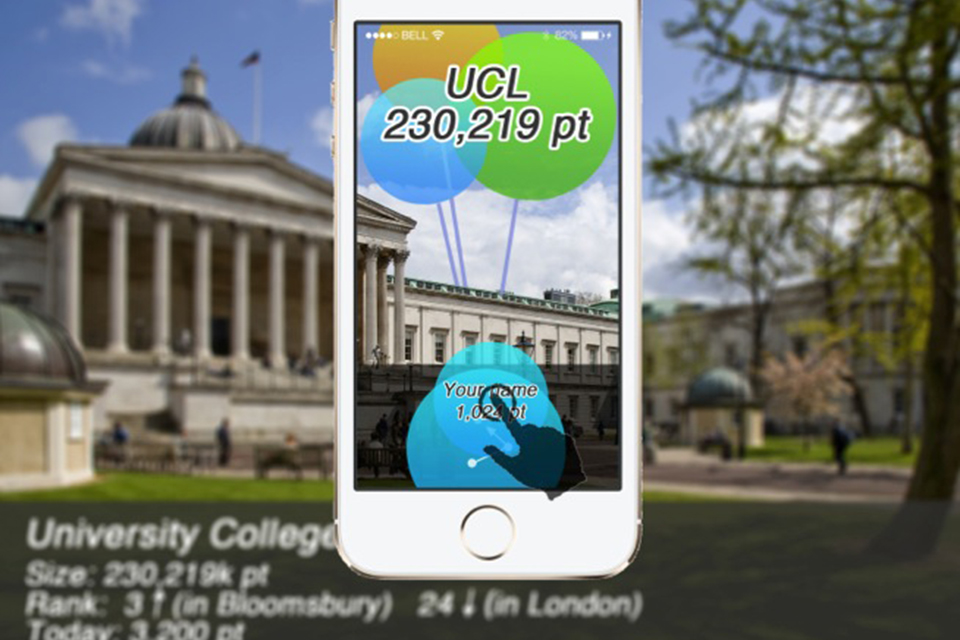
These released bubbles join the big bubble, the “balloons”, of each community, may it be streets, districts, cities, or countries. The size of the balloon represents the positive social action of a region. The application will calculate the positive social action of that area using a simple algorithm and represent the data in the form of a balloon floating over the area. It is a social competition: cities can compete with cities and streets can compete with streets.
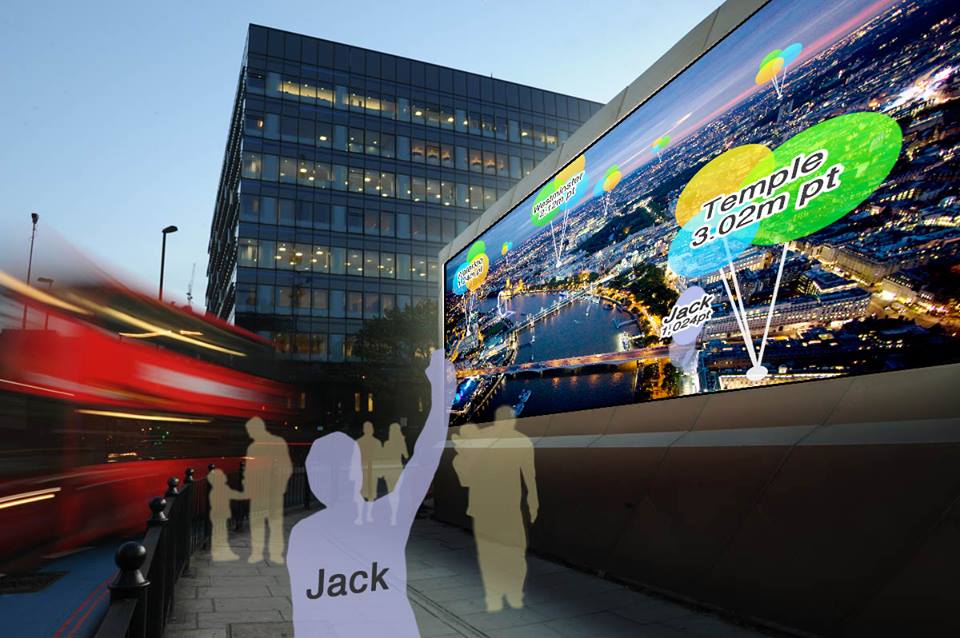
Infographics can be viewed on personal devices and desktop devices. To make any even bigger social impact, public electrical displays will be utilized: Piccadilly Circus in London, Time square in New York, Shinjuku in Tokyo. These large displays provide comparison of balloon sizes in competitive regions, and also serve as platforms for fun interaction people can accumulate large bubbles to release in front of the huge display so that their friends can see.
Release your bubble
Improve social awareness by virtual competition